Mean, Median, IQR
Mean- the average of all the numbers in your data set
*Take the sum of the data set and divide it by a number of numbers into your data.
Median- the middle value or midpoint of a data set.
Interquartile Range- a measure of variability, based on dividing a data set into quartiles.
Standard Deviation
Variance- measures the data distributes itself around
Standard- a measure that used to quantify the amount of variation of a data set.
*take the square root of the variance to find the deviation.
Formula used: E(x-m)^2
n
E= sigma (sum)
x= each number in data set
m= mu (mean of the data set)
n= amount of numbers in set
Bar Charts vs. Histograms
Bar Charts- columns are position over a label that represents a categorical variable.
-height determines the size of the group
Histograms-columns position over a label that represents a quantitative variable
-height indicates the size of the group
Data Shape Vocab
center- the point where data have the date is on both sides.
spread- refers to the variability of the data
shape- of the distribution is described by.
symmetry- a symmetric distribution can be divided at the center so each half is a mirror image of the other.
Number of peaks
unimodal- one clear peak (when in the center- called bell-shaped)
bimodal-two clear peaks
skewness- when one side of the distribution has more observations than the other
skewed right- fewer observations on the left
skewed left- fewer observations on the right.
uniform- when observations are equally spread across the range of the distribution
gaps - areas where there are no observations
outliers- extreme value
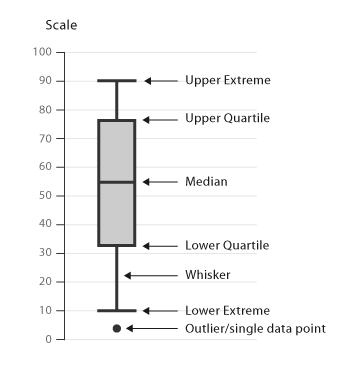 Here is a representation of a box plot.

