Box plots (also called box and whiskers) are used as a way to represent data.
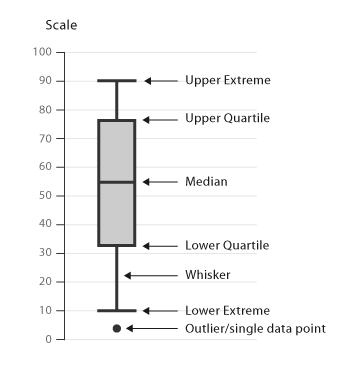 Here is a representation of a box plot.
To determine outliers
1. 5 number summary
2. Determine IQR
3. Multiply 1.5 IQR
4. Set up fences Q1 / (1.5 IQR) and Q3 + 1.5 IQR)
5. Observations "outside" the fences are outliers.
Describing Location in a Distribution
-Standardized Value
*One way to describe relative position in a data set is to tell how many standardized deviations above or below the mean and the observations.
Standardized Value: "z-score"
If the mean and standard deviation of a distribution are known, the "z- score" of a particular observation, x, is:

z= z-score
x=value
mue = mean
sigma = standard deviation
